
Head & Shoulders
Head & Shoulders
Of all the chart formations, the Head & Shoulders is probably the best known. It’s a major trend reversal pattern. Look at the Head & Shoulders top formation on the following chart. You can see that there are three parts, or high points, to it. All Top Head & Shoulder patterns have a “W” pattern and all Bottom Head & Shoulder Formations have an “M” pattern in it. Can you spot the “W” formation in the chart below?
Head & Shoulders usually form after a major price move has taken place. They take from several weeks to several months to form on a daily chart, and maybe several years to form on a weekly or monthly chart. Please note the neckline at the bottom of the formation. The neckline does not have to be straight across, or horizontal; nor do the shoulders have to be at equal price points and most of the time the right shoulder can have a 50% or 61.8% retracement towards the Head of the pattern.
Are you starting to see how the puzzle is starting to fit together yet?
Sometimes other patterns that we will review later may resemble a Head & Shoulders formation, so be careful when looking at them. They are one of the strongest trading formations that you can find.
Head & Shoulders Top - On the chart below, look at the three “tops” formed. The top is the left shoulder, the center top is the head, and the next top is the right shoulder.
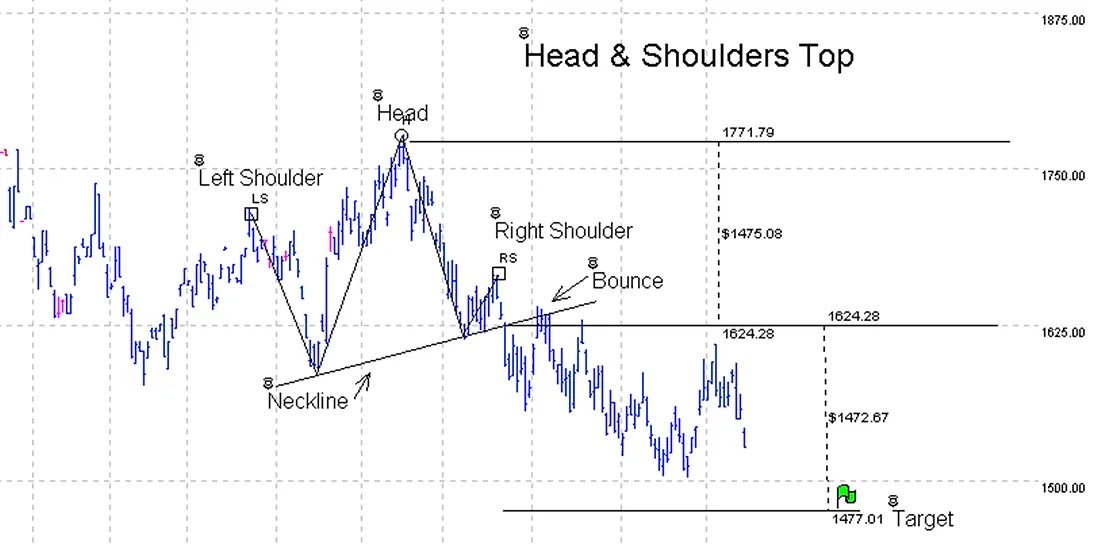
Look at the neckline. You would draw this neckline from the bottom of the left shoulder to the bottom of the right shoulder. In a top Head & Shoulder formation, you would place your order to go short below the neckline of the right shoulder, and place your stop at a resistance level above it that meets your reward/risk ratio. Today, all charting programs that I know of draw out the neckline for you. I know it does in TNTL.
Once the neckline is penetrated, the price should move a distance that is equal to the distance from the head to the breakout below the right shoulder, In the above example, I used Gecko’s Dollar Calculator tool to see where my target should be once the breakout occurred. You can see that it has come close to the target, but has not hit it yet.
The right shoulder may do a 50% or 61.8% Internal Retracement toward the head. If it does, I like the formation even better. Remember studying about this in an earlier lesson? It’s just an Internal 50% Retracement again. This will apply to a Head & Shoulders bottom formation as well, and we will take a look at one of those next.
Keep in mind, the neckline, once penetrated, should not be broken again, or it violates the whole formation.
The Bounce. In most cases, once the neckline is broken, the price will continue in that direction, but will then bounce back and touch the neckline again (Magnetic Trendline). Notice it did exactly that on this chart. Once the Bounce takes place and the price touches the neckline again but doesn't penetrate it, it’s an excellent time to add more contracts to go short from that point, as it means the formation is holding.
You can see on this chart that when the Bounce happened, it actually penetrated the neckline on three days, but on none of those days was the closing price above the neckline. In a previous lesson, you learned about what it takes to break the trendline. The same rules apply here too.
Head & Shoulders Bottom. This is the exact opposite formation of the Head & Shoulders Top. Look at the following chart. Where would you have placed your order to go long when it formed?
What is the distance between the bottom of the head and the penetration of the neckline? This distance should also be the target on the upside, as most times the price will travel past the neckline to almost an exact distance from the head to the neckline before it stops. It might make several bounces before it gets there Internal Retracements), but it should eventually get there.
Just like in the Top Head & Shoulders formation, expect to see a bounce-back down. Again, this is an excellent place to add contracts. Remember that the Neckline can act like a Magnetic Trendline and pull the price back to it. Always remember that Trendlines can act like magnets.

Many times, you will see a Breakaway Gap occur on the day it breaks the neckline on both top and bottom Head & Shoulder formations. Pay close attention to this. Look again at the chart for the Head & Shoulders Top. Do you see the gap at the breakout of the neckline? What kind of gap is it? Actually, there were three Gaps. Do you see them?
On the above chart, I used the Gecko Charts tool to draw a circle around the gap at the breakout of the neckline, and at the bounce. See the little green flag at my target? Gecko really makes it easy to visually see things on a chart. Are you drawing out your charts with the same detail that I am? If not, you should be.
Watch The Videos